|
|
Some articles have not been moved to our new site yet.
As a result you have been redirected to our old site.
If you wish to return to our new site - click here.
Analysis of political opinions
among drug users (UK 1998-2000)
Atha MJ, Davis S & Blanchard S (2001)
Independent Drug Monitoring Unit (IDMU
Ltd)
Abstract
Reported political views and voting intentions of
UK drug users were studied in anonymous surveys of 1153
cannabis users during 1998, 2172 in 1999 and 2352 in 2000
(Total 5677). The data included voting at the 1997 General
Election and if an election were held ‘tomorrow’,
with reasons for their choices, and attitudes to a range
of legislative drug policy options.
Over 40% of Labour supporters among users at the 1997
election have subsequently changed voting intention, with
a large swing to the Green Party. Health and environmental
issues are the main determining factors in deciding the
votes of drug users, however the evidence suggests that
drug policy to have become a much more significant factor
in deciding voter intentions.
While there is widespread support
for cannabis law reform, and strong opposition to current
government policies, the majority of users reject wider
legalisation of all drugs, or an unregulated free market
in cannabis. Most state that a change in the law would
neither increase nor decrease their level of use.
Friends, and other drug users, are
not only the most common source of drug information, but
are also regarded as the most credible by users. Government
Ministers, officials and police are considered the least
credible source of drugs information.
1. Methodology
1.1 Anonymous questionnaires were
distributed at a range of outdoor festivals and other
events during 1998, 1999 and 2000 as part of the IDMU
Regular Users, series of drug surveys, all valid forms
received by the closing dates were entered on to a
database, subsequently exported for statistical analysis
(Statview v5.0).
1.2 Respondents were asked to
indicate how they voted in the 1997 election, and
how they would vote in a general election ‘tomorrow’.
They were also asked to indicate (by circling options)
the main reasons for their actual and intended votes.
They were further asked to indicate how they rated
a specified list of drug legislation policies on a
0-10 scale.
1.3 The survey was not intended
to form a representative sample of all cannabis users,
as several batches of forms were distributed in Green-related
festival sites or by Green Party activists, thus one
would expected that ‘Green’ voters would
be overrepresented among our sample.
2. Party Politics
2.1 Of the three main parties,
Labour was overwhelmingly supported at the previous
election by those who voted, with just under 29% of
users electing the present government. The Liberal
Democrats came in second place at 11.4%, 9.4% claimed
to have voted ‘Green’, with the Conservatives
trailing badly under 3%. . However, 44% of respondents
did not vote, either because they refused to do so,
were unable to vote (underage), or were not interested.
The ‘Legalise’ option is attributable to
a handful of candidates standing on pro-legalisation
tickets, and would reflect the presence of a number
of pro-cannabis activists within the sample.
2.2 Intended voting patterns showed
a substantially higher level of support for the Green
party, with over a third of respondents expressing
support. Labour support was at 17%, ahead of the Liberal
Democrats on 14%, with the Conservative party supported
by only 2.4% of respondents.
2.3 Comparing past allegiance
with voting intentions, it would appear that over
40% of Labour voters from the last election had switched
allegiance, with the Green Party and to a lesser extent
the Liberal Democrats the beneficiaries. The Conservative
party, from a very low base, also lost much of what
little support it had at the last election. The increase
in Green support may be illusory, reflecting a lack
of candidates in the General Election, and tactical
voting to oust the Conservatives. The proportion who
do not vote has decreased by nearly a quarter, suggesting
that drug users may be becoming more politically active.
The haemorrhaging of Labour support, maybe half a
million votes across the UK, probably reflects the
strong anti-drugs and anti-cannabis stance taken by
the current government since the 1997 election.
2.4 Long Term Trends?:
It is instructive to compare these results with data
from a comparable sample taken in 1984 during the
Thatcher administration, at the height of the Miners
strike, but before the ‘Battle of the Beanfield’
and active government opposition to the festival movement.
The popularity of the Greens (Ecology) in 1984 was
similar to the expressed intention in 1998, and the
Labour party appears marginally less popular in 1998
than 14 years earlier when in opposition.
2.5 The proportion of respondents
reporting having voted Labour in 1997 has declined
steadily from 25% in 1998 to 27% in 2000, and similarly
the recalled ‘green’ vote has declined -
possibly reflecting changes in recruitment locations
in 1999 and 2000. The higher number of ‘Nationalist’
(SNP/PC) reports in 2000 is no doubt derived from
a larger than usual sample of Scottish residents.
|
Voting History of Cannabis Users
(1998-2000)
|
|
Last Election
|
1998
|
1999
|
2000
|
1998-2000
|
|
Party
|
n
|
%
|
n
|
%
|
n
|
%
|
n
|
%
|
|
Labour
|
347
|
34.6%
|
563
|
27.8%
|
575
|
26.7%
|
1485
|
28.7%
|
|
Conservative
|
38
|
3.8%
|
65
|
3.2%
|
45
|
2.1%
|
148
|
2.9%
|
|
Lib Dem
|
176
|
17.5%
|
217
|
10.7%
|
200
|
9.3%
|
593
|
11.4%
|
|
Green
|
125
|
12.5%
|
192
|
9.5%
|
171
|
7.9%
|
488
|
9.4%
|
|
SNP/Plaid Cymru
|
19
|
1.9%
|
22
|
1.1%
|
48
|
2.2%
|
89
|
1.7%
|
|
Underage
|
22
|
2.2%
|
193
|
9.5%
|
189
|
8.8%
|
404
|
7.8%
|
|
Did not vote
|
271
|
27.0%
|
737
|
36.4%
|
884
|
41.1%
|
1892
|
36.5%
|
|
Legalisation
|
5
|
0.5%
|
16
|
7.9%
|
3
|
0.1%
|
24
|
0.5%
|
|
Other
|
8
|
0.8%
|
19
|
9.0%
|
36
|
1.8%
|
63
|
1.2%
|
|
Total
|
1003
|
100%
|
2024
|
100%
|
2153
|
100%
|
5180
|
100%
|
|
Voting Intention of Cannabis Users
(1998-2000)
|
|
Last Election
|
1998
|
1999
|
2000
|
1998-2000
|
|
Party
|
n
|
%
|
n
|
%
|
n
|
%
|
n
|
%
|
|
Labour
|
173
|
17.7%
|
319
|
17.0%
|
308
|
15.6%
|
800
|
16.6%
|
|
Conservative
|
18
|
1.8%
|
54
|
2.9%
|
43
|
2.2%
|
115
|
2.4%
|
|
Lib Dem
|
186
|
19.0%
|
230
|
12.3%
|
273
|
13.8%
|
689
|
14.3%
|
|
Green
|
313
|
32.0%
|
637
|
34.0%
|
612
|
31.0%
|
1562
|
32.4%
|
|
SNP/Plaid Cymru
|
25
|
2.6%
|
22
|
1.2%
|
53
|
2.7%
|
100
|
2.1%
|
|
Underage
|
39
|
4.0%
|
87
|
4.7%
|
81
|
4.1%
|
207
|
4.3%
|
|
Will not vote
|
202
|
20.7%
|
483
|
25.8%
|
548
|
27.8%
|
1233
|
25.6%
|
|
Legalisation
|
11
|
1.1%
|
11
|
0.6%
|
6
|
0.3%
|
28
|
0.6%
|
|
Other
|
11
|
1.1%
|
29
|
1.5%
|
50
|
2.5%
|
90
|
1.9%
|
|
Total
|
977
|
100%
|
1872
|
100%
|
1974
|
100%
|
4823
|
100%
|
|
Change in Voting Intention of Cannabis
Users (1998-2000)
|
| |
1998
|
1999
|
2000
|
98-00
|
1984
|
84-00
|
|
Party
|
%
|
%
|
%
|
change
|
n
|
%
|
change
|
|
Labour
|
-16.9%
|
-10.8%
|
-11.1%
|
-12.1%
|
112
|
18.3%
|
-1.7%
|
|
Conservative
|
-1.9%
|
-0.3%
|
0.1%
|
-0.47%
|
26
|
4.2%
|
-1.8%
|
|
Lib Dem
|
1.5%
|
1.6%
|
4.5%
|
2.84%
|
26
|
4.2%
|
9.6%
|
|
Green
|
19.6%
|
24.5%
|
23.1%
|
23.0%
|
205
|
33.4%
|
-1.4%
|
|
SNP/Plaid Cymru
|
0.7%
|
0.1%
|
0.5%
|
0.36%
|
*
|
n/a
|
n/a
|
|
Underage
|
n/a
|
-4.9%
|
-4.7%
|
-3.51%
|
*
|
n/a
|
n/a
|
|
Will not vote
|
-6.3%
|
-10.6%
|
-13.3%
|
-11.0%
|
*
|
n/a
|
n/a
|
|
Legalisation
|
0.6%
|
-0.7%
|
0.2%
|
0.12%
|
*
|
n/a
|
n/a
|
|
Other
|
0.3%
|
-7.5%
|
0.7%
|
0.65%
|
245*
|
40.0%
|
n/a
|
Notes:
Last
Vote:
Other included communist, socialist, BNP, looneys,
Natural Law, Referendum (3) Did not vote included
spoiled ballots (4). Underage included those who
expressed preferences. 150 gave no response
Next vote: Other includes
- ‘any far left’, class war, communist,
socialist, looney (3), Natural Law, Referendum,
‘me’, Radical Party (italian respondent).
Will not vote includes 5 intending to spoil ballots.
176 gave no response.
* 1984 data: Asked respondents
to circle party closest to own political beliefs.
Libdem included SDP/Alliance, ‘Other’
category consolidated ‘other socialist/communist’,
SNP/PC, Nat Front, Anarchy, Not interested, Don’t
Know and a write-in option. Original raw data
not currently accessible for direct comparisons.
3. Reasons for voting
3.1 Respondents expressed a wide
range of reasons for their past vote or current intentions,
including the negative (dont trust ‘x,y or all
of them’, tactical voting, Tories out etc), the
practical (not registered, no green candidate) the
principled (Referendum party, anarchist, socialism/workers
rights), and the silly or obscure ("I was on
LSD", "nice suits", "Yogic Flying").
Many respondents chose a range of the listed options.
3.2 Past vote: Health &
Education was the main reason, closely followed by
environment. Half as many (14%) cited the economy,
with drug policy a deciding factor for one in nine
respondents, followed by constitutional issues (9%).
Defence, Crime and European policy were each cited
by less than 5% of respondents. Nearly four in ten
respondents cited other factors to have influenced
their vote.
3.3 The relative importance of
drug policy on determining respondents’ 1997
vote has doubled from 11.1% of respondents in 1998
to 22.4% in 2000.
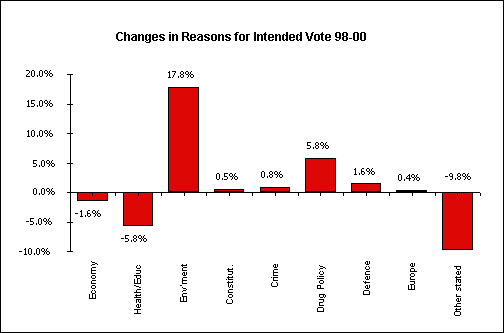
3.3 Next vote: The most
significant factor in influencing voting intention
was environmental issues, now cited by 52% of respondents
an increase of 18%, Health & Education was slightly
down by 6% in second place (31%), followed by drug
policy (24%, up 6%), and the economy (21% down 1.6%).
Fewer respondents cited ‘other reasons’.
Defence had doubled in significance (from a low base),
possibly reflecting increased international tension,
and constitutional issues had become more important,
possibly reflecting devolution and the future of the
House of Lords. All of the listed options showed slight
or significant increases in importance, with fewer
other issues (largely relating to the previous government)
a major factor. The apparent increase in the prominence
of drug policy may reflect an real increase in the
politicisation of users following the active government
support for prohibition policies, or may reflect the
fact that this was a survey targeted at drug users,
with policy options to consider, raising the profile
of the issue in the mind of the respondent.
|
Main Policy Issues influencing vote
or voting intentions of cannabis users
(1998-2000)
|
| |
Last Election
|
Next
Election
|
|
Reason
|
1998
|
1999
|
2000
|
Total
|
%
|
1998
|
1999
|
2000
|
Total
|
%
|
% Chge
|
|
Economy
|
116
|
230
|
225
|
571
|
22%
|
132
|
245
|
249
|
626
|
21%
|
-1.6%
|
|
Health/Educ
|
212
|
388
|
350
|
950
|
37%
|
211
|
401
|
335
|
947
|
31%
|
-5.8%
|
|
Env’ment
|
209
|
363
|
307
|
879
|
34%
|
331
|
650
|
593
|
1574
|
52%
|
17.8%
|
|
Constitut.
|
74
|
118
|
114
|
306
|
12%
|
92
|
150
|
134
|
376
|
12%
|
0.5%
|
|
Crime
|
29
|
75
|
68
|
172
|
7%
|
34
|
93
|
100
|
227
|
8%
|
0.8%
|
|
Drug Policy
|
90
|
192
|
194
|
476
|
19%
|
163
|
280
|
295
|
738
|
24%
|
5.8%
|
|
Defence
|
18
|
71
|
58
|
147
|
6%
|
35
|
101
|
85
|
221
|
7%
|
1.6%
|
|
Europe
|
38
|
134
|
104
|
276
|
11%
|
39
|
176
|
123
|
338
|
11%
|
0.4%
|
|
Other stated
|
317
|
417
|
363
|
1097
|
43%
|
148
|
610
|
241
|
999
|
33%
|
-9.8%
|
|
Base
|
810
|
881
|
864
|
2555
|
100%
|
740
|
1160
|
1117
|
3017
|
100%
|
0
|
Note:
As many respondents gave more than one reason,
columns cannot be added together to form totals.
4. Attitudes to Alternative Drug Policy Options?
4.1 Support among cannabis users
is highest for policies which would distinguish between
cannabis and other controlled drugs. Cannabis legalisation
(78% for - 8% against) and decriminalisation of cannabis
alone (73% - 12%) attracted the widest levels of support.
4.2 Equal numbers supported and
opposed an unregulated free market in cannabis or
other drugs, with 38% in favour and 38% against, 30%
being strongly opposed. Prescription (61% - 17%) and
licensing systems (50% - 23%) both received lukewarm
approval.
4.3 The status quo was roundly
rejected (5% - 83%), as would be increased penalties
for all drugs (3% - 91%), these options were strongly
opposed by 77% and 88% respectively. However, there
was a majority against the legalisation of all drugs
(30% - 57%) with 50% strongly opposed, and a substantial
minority (22% - 63%) would support increased penalties
for (unspecified) ‘hard drugs’.
|
Ratings of drug policy/legislative
options by cannabis users 1998 and 2000
|
|
Policy
|
Total
|
Mean rating
|
Strong positive (8-10)
|
Weak positive (6-7)
|
Neutral (5)
|
Weak negative (3-4)
|
Strong negative (0-2)
|
| |
n
|
(1-10)
|
n
|
%
|
n
|
%
|
n
|
%
|
n
|
%
|
n
|
%
|
|
Legalise Cannabis Only
|
2945
|
7.6
|
1982
|
67%
|
328
|
11%
|
377
|
13%
|
69
|
2%
|
189
|
6%
|
|
Decriminalise cannabis possession, not supply
|
2790
|
7.0
|
1696
|
61%
|
327
|
12%
|
432
|
15%
|
71
|
3%
|
264
|
9%
|
|
Free-market
|
2555
|
5.0
|
780
|
31%
|
199
|
8%
|
649
|
25%
|
192
|
8%
|
773
|
30%
|
|
Licensing
|
2571
|
6.0
|
952
|
37%
|
341
|
13%
|
675
|
26%
|
157
|
6%
|
446
|
17%
|
|
Prescription
|
2610
|
7.3
|
1379
|
53%
|
233
|
9%
|
539
|
21%
|
117
|
4%
|
342
|
13%
|
|
Legalise all drugs
|
2785
|
3.5
|
680
|
24%
|
174
|
6%
|
350
|
13%
|
193
|
7%
|
1388
|
50%
|
|
Medical Use Only
|
1687
|
5.1
|
547
|
32%
|
171
|
10%
|
411
|
24%
|
104
|
6%
|
454
|
27%
|
|
Stay the same
|
2466
|
1.4
|
95
|
4%
|
35
|
1%
|
282
|
11%
|
148
|
6%
|
1905
|
77%
|
|
Increase penalties all drugs
|
2509
|
0.8
|
58
|
2%
|
31
|
1%
|
128
|
5%
|
87
|
3%
|
2205
|
88%
|
|
Increase penalties hard drugs
|
2521
|
0.9
|
440
|
17%
|
133
|
5%
|
351
|
14%
|
132
|
5%
|
1465
|
58%
|
4.4 Users were asked to assess
how a relaxation in the cannabis laws would influence
their use of the drug. Most respondents (78.5%) stated
their level of use would be unchanged, and less than
10% of users believed their consumption would increase.
|
Expected Changes in Level of Cannabis
Use if Law was Relaxed
|
|
Stated use would
|
2000
|
1998
|
Overall
|
|
|
n
|
%
|
n
|
%
|
n
|
%
|
|
Increase
|
195
|
9.5%
|
95
|
9.5%
|
290
|
9.5%
|
|
Decrease
|
54
|
2.6%
|
14
|
1.4%
|
68
|
2.2%
|
|
Stay the same
|
1625
|
79.3%
|
771
|
76.8%
|
2396
|
78.5%
|
|
Don't know
|
175
|
8.5%
|
124
|
12.4%
|
299
|
9.8%
|
|
Base
|
2049
|
100%
|
1004
|
100%
|
3053
|
100%
|
5. Sources and Credibility of Drug Information
5.1 In 2000, respondents were
asked to rate the reliability of a range of listed
sources of drug information, and to list those which
they considered major sources of drug information
for themselves.
5.2 The influence factor (I) represents
the product, for each source, of the number of respondents
reporting that as a major source of information (n(M)),
multiplied by the mean credibility (C) of that source,
expressed as a percentage of the total, i.e.
I1
= C1n(M1)/
S
(C1n(M1)+C2n(M2)+Cnn(Mn)).
|
Credibility of Drug Information
Sources
|
|
Source of
|
Credibility
|
Major
Source
|
Influence
|
|
Information
|
Mean (0-10)
|
No of reports
|
n
|
%
|
%
|
|
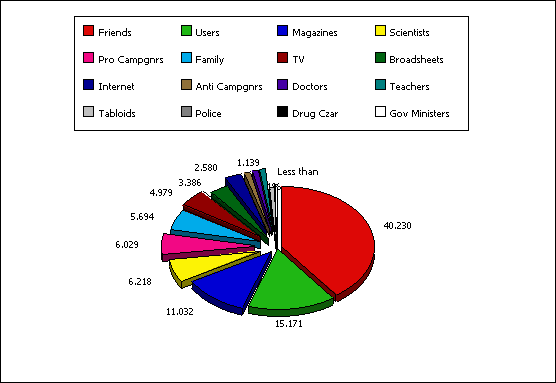
Friends
|
7.77
|
1620
|
1422
|
60.5%
|
40.2%
|
|
Drug Users
|
6.48
|
1318
|
643
|
27.3%
|
15.2%
|
|
Magazines
|
5.43
|
1432
|
558
|
23.7%
|
11.0%
|
|
Scientists
|
5.75
|
1396
|
297
|
12.6%
|
6.2%
|
|
Pro-reform Campaigners
|
5.69
|
1348
|
291
|
12.4%
|
6.0%
|
|
Family
|
4.32
|
1532
|
362
|
15.4%
|
5.7%
|
|
Television
|
3.21
|
1502
|
426
|
18.1%
|
5.0%
|
|
Broadsheet Newapapers
|
3.72
|
1439
|
250
|
10.6%
|
3.4%
|
|
Internet
|
5.41
|
1273
|
131
|
5.6%
|
2.6%
|
|
Anti-drug Campaigners
|
2.32
|
1401
|
145
|
6.2%
|
1.2%
|
|
Doctors
|
5.30
|
1410
|
59
|
2.5%
|
1.1%
|
|
Teachers
|
3.00
|
1402
|
102
|
4.3%
|
1.1%
|
|
Tabloid Newspapers
|
1.57
|
1497
|
120
|
5.1%
|
0.7%
|
|
Police Officers
|
2.38
|
1419
|
27
|
1.1%
|
0.2%
|
|
Drug Czar
|
1.85
|
1212
|
21
|
0.9%
|
0.1%
|
|
Government Ministers
|
1.43
|
1405
|
27
|
1.1%
|
0.1%
|
5.3 Friends are overwhelmingly
the major source of information, both in terms of
the numbers of respondents reporting friends as a
major information source, and in the credibility for
the user of friends opinions. The next most credible
and frequently cited source was other drug users.
Other sources with positive (credibility ratings (over
5/10) were scientists, pro-reform campaigners, magazines,
the internet and doctors (although doctors were, surprisingly,
one of the least commonly cited major sources of drug
information).
5.4 At the other end of the scale,
Government Ministers were considered the least credible
source of information, rivalled only by the drugs
czar (the least commonly reported source) and police
officers. Other sources with negative credibility
included tabloid newspapers (the second least credible
source behind ministers), anti-drug campaigners, television,
broadsheets, and family members.
6 Conclusions
6.1 Recreational drug users are alientated
from the political process to an alarming degree. A high
(and increasing) propotion of users report no intention
to vote at the coming election, many citing total disillusionment
with politics and politicians of whatever persuasion.
6.2 Support among drug users for the
Labour Party has fallen substantially, with four in ten
former Labour voters in 1997 no longer supporting the
party. There is a substantial and consistent swing towards
the Green party, which is the only major political party
in the UK to offer unequivocal support for a program for
drug law reform.
6.3 Current Government drug policies
lack any credibility or support from the people they are
ostensibly designed to protect. Government ministers and
the UK Anti-Drugs Co-ordinator have the lowest credibility
rating of all sources of drug information.
6.4 Doctors, in particular, appear
to be an underused resource in disseminating drug advice,
being considered credible by users, but rarely cited as
a major source of drug information.
6.5 Drug users overwhelmingly support
law reform, particularly legalisation of cannabis. However,
a majority oppose legalisation of all drugs, roughly one
in four users would consider drug policy a major determinant
of their voting intentions.
6.6 If a major political party were
to include legalisation of cannabis as a manifesto commitment,
this could result in up to a million additional votes,
and may also reduce the abstentionism prevalent amongst
younger citizens as a whole. © IDMU publications
11-5-01
|
All contents of this web
site & any links to other sites etc, is for educational
& research purposes. IDMU at no time seeks to encourage
illegal activities. All sections of this site and its contents
are protected under copyright laws. © IDMU
Ltd 1994 - 2008
|
|
|
|