
2001
IDMU Drug User Survey
First results from the 2001 IDMU Regular Users Survey show a continuing
fall in British cannabis prices, and evidence that cannabis
users are smoking more as a result.
Cannabis Market Shares - Domestically-produced cannabis now
accounts nearly half the UK market, largely displacing
imported herbal cannabis, and Moroccan resin (commonly
known as soap-bar), which dominated the UK market during
the 1990s, has been overtaken as the market leader by
home-produced Skunk.
By
2001 domestically-produced cannabis accounted for nearly
half of UK consumption, the market share of skunk now
exceeding that of Moroccan (soap-bar) resin for the
first time. Skunk was not specifically mentioned in
1984, although Home Grown then took up around 10% of
the UK market, and leaf material still adds roughly
1/4 to the recent figures for skunk consumption. In
1984 Lebanese was the most common form of cannabis resin,
although this has been rarely seen in the UK since the
late 1980s, to the extent that it was removed from the
surveys from 2000 on, although press reports suggest
production in the Beka a valley to have resumed recently..
It is interesting to note that average monthly cannabis use rose sharply
in 2001, accelerating the trend since the mid 1990s,
which may reflect price elasticity, as respondents are
still spending similar amounts, but are now able to
buy more cannabis for their money. Note: The
2002 results should show whether the high level of use
in the 2001 survey was a statistical blip (due to the
smaller sample and narrower regional user base) or a
continuation of the upward trend.
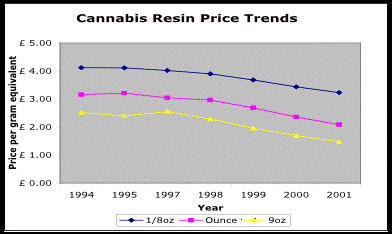
Cannabis prices rose sharply in 1985-86 and peaked in the late 1980s,
but have been falling steadily since the early 1990s,
and more substantially since 1998. The past four years
have shown a steady shift of the deal price from £15
down to £10, such that by 2001 £10 was overwhelmingly
the most common price.
Other than competition between resin and the higher-quality skunk cannabis,
there would appear to be no clear reason why cannabis
prices have fallen so sharply, for instance there is
no evidence of reduced demand for the drug " indeed
consumption has been rising since 1998, It is possible
that cannabis importers and distributors have become
more professional and efficient in their trafficking
methods.
Although prices for amphetamine have remained relatively stable, average
purities increased four fold between 1994 and 1998/9.
From 1998 onwards, respondents were asked to distinguish
between low quality (street) and higher quality (base)
amphetamine, partly responsible for the apparent fall
in (particularly) ounce prices, and subjective ratings
of the drug.
Cocaine prices have remained broadly stable, an ounce (28g) would typically
sell for around £600 (range £500-£1600), with £50 overwhelmingly
the most common gram price, although by 2001 the price
trend again appears downwards.
Heroin prices have fallen, and the size of bags has increased, to the
extent that buying in £10 bags gives gram-equivalent
prices of £50-£100 - heroin purities vary considerably,
from around 15% up to 70% plus - such variations arise
within the country of manufacture, as there is little
evidence of the drugs being systematically cut in the
UK market (average purities from police and customs
seizures are similar).
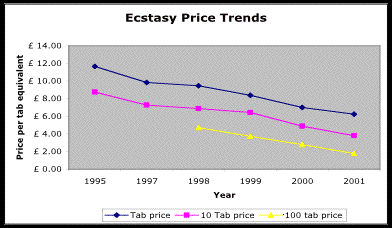
Ecstasy prices continue to fall substantially, to the extent that individual
tablets now sell most commonly for £5, and even small
quantities can be obtained for around £2 each. This
may be due to a combination of reduced demand (via health
concerns about serotonin depletion) or more efficient
distribution methods resulting in a saturated market.
Although there were high ratings of the drug in 99-00
suggesting the image of the drug to be improving rather
than deteriorating in the eyes of users as a whole,
the significant drop in 2001 suggests the health message
may finally be getting through.
LSD has fallen in popularity, with fewer police seizures, and fewer
price reports, slightly higher than more recent years.
The user-ratings of LSD have been falling steadily.
|
IDMU REGULAR USERS SURVEYS
UK Drugs Price Trends - 1984-2001
|
|
|
1984
|
1994
|
1995
|
1997
|
1998
|
1999
|
2000
|
2001
|
|
Moroccan
8th
|
£7.00
|
£14.41
|
£14.39
|
£14.06
|
£13.64
|
£12.88
|
£12.01
|
£11.29
|
|
Moroccan
oz
|
-
|
£88.34
|
£89.77
|
£85.09
|
£82.95
|
£75.02
|
£65.91
|
£58.41
|
|
Moroccan
9oz
|
-
|
£629.26
|
£599.35
|
£636.72
|
£570.81
|
£487.29
|
£422.63
|
£366.55
|
|
Moroccan
Market share
|
9.9%
|
34.7%
|
28.1%
|
49.2%
|
36.0%
|
38.8%
|
31.9%
|
33.5%
|
|
No.
reporting (Maroc)
|
n/a
|
410
|
98
|
328
|
422
|
647
|
472
|
140
|
|
Skunk
8th
|
-
|
£21.26
|
£20.21
|
£20.63
|
£20.82
|
£20.98
|
£20.70
|
£19.94
|
|
Skunk
oz
|
-
|
£128.79
|
£131.62
|
£128.00
|
£133.88
|
£127.65
|
£124.39
|
£116.20
|
|
Skunk
9oz
|
-
|
£888.85
|
£875.00
|
£881.54
|
£923.38
|
£856.40
|
£828.64
|
£767.07
|
|
Skunk
Market share
|
-
|
12.9%
|
17.6%
|
27.6%
|
26.7%
|
31.7%
|
30.7%
|
39.1%
|
|
No.
reporting (skunk)
|
-
|
309
|
52
|
325
|
436
|
673
|
553
|
229
|
|
Subjective
rating (0-10)
|
|
8.8
|
8.5
|
8.8
|
8.4
|
8.3
|
8.4
|
8.6
|
|
Cannabis
used/month
|
29.3g
|
24.8g
|
31.3g
|
23.9g
|
20.7g
|
26.9g
|
31.6g
|
44.5g
|
|
Amphetamine
Gram
|
-
|
-
|
£8.28
|
£8.07
|
£8.04
|
£8.74
|
£8.43
|
£8.71
|
|
Amphetamine
Ounce
|
-
|
-
|
£99.26
|
£99.24
|
£85.79
|
£83.04
|
£72.88
|
£76.00
|
|
Subjective
rating (0-10)
|
-
|
5.3
|
5.4
|
5.6
|
4.6
|
4.8
|
4.5
|
3.7
|
|
No.
reporting (amphet)
|
-
|
-
|
97
|
447
|
376
|
504
|
364
|
70
|
|
Ecstasy
tab
|
-
|
-
|
£11.65
|
£9.84
|
£9.46
|
£8.38
|
£6.99
|
£6.24
|
|
Ecstasy
10 tabs
|
-
|
-
|
£87.57
|
£72.66
|
£68.66
|
£64.33
|
£48.75
|
£37.84
|
|
Ecstasy
100 tabs
|
-
|
-
|
-
|
-
|
£469.83
|
£371.67
|
£277.52
|
£176.25
|
|
Subjective
rating (0-10)
|
-
|
6.4
|
6.8
|
6.9
|
6.8
|
7.1
|
7.0
|
6.4
|
|
No.
reporting (ecstasy)
|
-
|
-
|
108
|
486
|
430
|
541
|
400
|
111
|
|
LSD
tab
|
-
|
-
|
£2.99
|
£3.25
|
£3.28
|
£3.26
|
£3.53
|
£3.73
|
|
LSD
10 tabs
|
-
|
-
|
£20.15
|
£22.78
|
£22.48
|
£27.46
|
£25.82
|
£28.38
|
|
LSD
100 tabs
|
-
|
-
|
£88.33
|
£124.29
|
£143.11
|
£127.34
|
£146.25
|
£175.00
|
|
Subjective
rating (0-10)
|
-
|
6.9
|
7.3
|
7.2
|
6.7
|
6.9
|
6.6
|
6.2
|
|
No.
reporting (LSD)
|
-
|
-
|
114
|
525
|
409
|
493
|
377
|
77
|
|
Cocaine
gram
|
-
|
-
|
£56.66
|
£50.51
|
£51.92
|
£50.55
|
£49.38
|
£46.20
|
|
Subjective
rating (0-10)
|
-
|
5.5
|
5.7
|
6.1
|
5.7
|
6.2
|
5.6
|
5.0
|
|
No.
reporting (cocaine)
|
-
|
-
|
50
|
222
|
308
|
406
|
317
|
90
|
|
Crack
Rock
|
-
|
-
|
£21.50
|
£21.64
|
£19.38
|
£23.65
|
£20.48
|
£18.91
|
|
Subjective
rating (0-10)
|
-
|
2.1
|
3.4
|
2.6
|
1.8
|
2.5
|
2.3
|
2.1
|
|
No.
reporting (crack)
|
-
|
-
|
5
|
36
|
32
|
57
|
47
|
19
|
|
Heroin
gram
|
-
|
-
|
£83.33
|
£69.69
|
£71.25
|
£56.40
|
£60.00
|
£54.00
|
|
Subjective
rating (0-10)
|
-
|
2.5
|
2.9
|
2.7
|
2.2
|
3.0
|
2.4
|
1.8
|
|
No.
reporting (heroin)
|
-
|
-
|
9
|
46
|
48
|
87
|
57
|
19
|
|
Survey
Series
|
n/a
|
I
|
II
|
II
|
III
|
IV
|
V
|
VI
|
|
Total
Respondents
|
607
|
1333
|
215
|
1136
|
1153
|
2173
|
2353
|
681
|
Notes for Editors
The Independent Drug Monitoring Unit - I.D.M.U. Ltd is a research consultancy
specializing in the study of drug use and the drugs
market in the UK. Our mission is to provide accurate,
up to date and unbiased information to all parties in
the drugs debate, and expert evidence to the Criminal
Justiice System.
All data was collected from IDMU surveys using anonymous questionnaires
distributed via pop-festivals, cannabis rallies, drug-subculture
magazines, and by snowball samples. The 1984 data is
derived from Quantitative Assessment of Illicit Substance
Use, Atha MJ (1987), Birmingham University.
Respondents were asked to indicate the prices paid for a range of drugs
at different market levels, as well as the proportion
of different cannabis varieties they has used over the
previous year, from which overall market shares were
derived.
Subjective Ratings represent the average marks out of 10 ascribed to
each drug by survey respondents as a whole (drug users,
but not necessarily users of that particular drug)
Number reporting (drug) refers to the maximum number of respondents
reporting prices for that drug in the smallest quantities
- there may be respondents quoting prices for larger
but not smaller quantities who would be unrecorded in
these figures. Please note that in 2000 a higher proportion
of respondents failed to complete the prices section
of the questionnaire (which was on the last page), thus
comparisons with the total respondents will be affected
by the questionnaire layout, however comparisons of
relative numbers reporting different drugs would be
a valid exercise.
The 1995 survey was intended to fill the gap from results in 1994,
which failed to ask prices for drugs other than cannabis,
as this was a substantially smaller sample, more variation
is to be expected. The 2001 survey was a relatively
small sample compared to recent years, and geographically
biased towards London & the South East, and the
North West UK, thus the data may be less reliable than
in previous years, however as London and the South East
tend o have higher prices than the rest of the UK (with
drugs, as with other commodities) the continuing fall
in drugs prices may be greater over the rest of the
UK. As several new questions were introduced in 2001
the same series will continue to be used for the 2002
survey.
Note on NCIS prices: The price lists published periodically
by NCIS are supplied to the service by individual police
forces (usually a single drugs liaison officer within
each force). There is no standardised methodology for
recording prices and the nature of price reports to
police (i.e. from defendants, informants, test-purchases
and/or general market intelligence), which vary considerably
from the genuine cannabis ounces to the fictional £10
per gram (cannabis is very rarely sold in grams).
Citation/Release - You may publish statistics and other details
provided above, including any graphs derived from the
data, provided the source is accredited as Independent
Drug Monitoring Unit (www.idmu.co.uk).