Some articles have not been moved to our new site yet.
As a result you have been redirected to our old site.
If you wish to return to our new site -
click here.
Crack
- Prices & Frequency of use (1999 data)
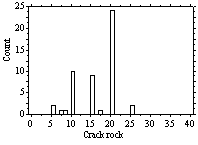
Range of Crack Prices 1999


Crack "rocks" are of indeterminate
size (average 150-200mg), a gram rock could sell for
£60-£100, most small deals are between £10 and £20.
|
Crack rock - 1999 Prices by region
|
|
Group:
|
Count:
|
Mean:
|
Std. Dev.:
|
Std. Error:
|
|
London
|
12
|
35.62
|
41.86
|
12.08
|
|
South East
|
8
|
22.88
|
16.05
|
5.67
|
|
South West
|
13
|
15.58
|
4.8
|
1.33
|
|
East Anglia
|
4
|
45*
|
40.41
|
20.21
|
|
Midlands
|
8
|
17.5
|
6.55
|
2.31
|
|
Wales
|
4
|
16.25
|
4.79
|
2.39
|
|
Yorks/Humbs
|
2
|
12.5
|
3.54
|
2.5
|
|
North West
|
3
|
16.67
|
5.77
|
3.33
|
|
North East
|
1
|
10
|
s
|
s
|
|
Scotland
|
1
|
60*
|
s
|
s
|
|
Other/not stated
|
1
|
5
|
s
|
s
|
|
Overall
|
57
|
23.65
|
24.59
|
3.26
|
|
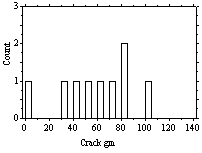
Crack gram - 1999 Prices by
region
|
|
Group:
|
Count:
|
Mean:
|
|
London
|
2
|
90
|
|
South East
|
1
|
80
|
|
South West
|
2
|
50
|
|
East Anglia
|
0
|
s
|
|
Midlands
|
3
|
50
|
|
Wales
|
0
|
s
|
|
Yorks/Humbs
|
0
|
s
|
|
North West
|
0
|
s
|
|
North East
|
0
|
s
|
|
Scotland
|
0
|
s
|
|
Other/not stated
|
0
|
s
|
|
Overall
|
8
|
63.75
|
Frequency of Use (Crack)
Of the major drugs of abuse, use of crack cocaine was
rarest, with only 10.6% of drug users evver having tried
it, and with 1.5% using regularly or daily. Of the 176
individuals who had tried the drug, 134 (76%) had either
used on an experimental basis, or had stopped using
the drug.
|
Frequency of use
|
Count
|
% of responses
|
% of users
|
% excl. missing
|
Overall %
|
|
EXP
|
91
|
12.30
|
51.70
|
5.47
|
4.19
|
|
OCC
|
21
|
2.84
|
11.93
|
1.26
|
0.97
|
|
REG
|
14
|
1.89
|
7.95
|
0.84
|
0.64
|
|
DAI
|
7
|
0.95
|
3.98
|
0.42
|
0.32
|
|
STO
|
43
|
5.81
|
24.43
|
2.58
|
1.98
|
|
NEV
|
564
|
76.22
|
320.45
|
33.89
|
25.95
|
|
MIS
|
1433
|
193.65
|
|
86.12
|
65.95
|
|
Total Ever
|
176
|
|
|
10.58
|
8.10
|
Key - EXP
(experimental) <10 times, OCCasional (<monthly)
REGular (>Monthly), DAIly, STOpped using, NEVer used,
MISsing values (mostly non-users). Exc Missing - excluded
forms where frequency data missing for all drugs listed
(i.e. users who had failed to complete the survey).
|
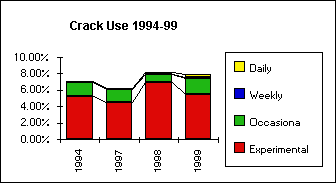
Trends in Crack use 1994-99
|
|
Frequency of use
|
1994
|
1997
|
1998
|
1999
|
|
Non/ex-users
|
92.95%
|
93.75%
|
91.76%
|
86.84%
|
|
Experimental
|
5.32%
|
4.58%
|
6.94%
|
5.47%
|
|
Occasional
|
1.65%
|
1.50%
|
1.00%
|
1.98%
|
|
Weekly
|
0%
|
0.10%
|
0%
|
0.12%
|
|
Daily
|
0.10%
|
0%
|
0.30%
|
0.42%
|

Overall usage of crack has remained stable at 6-8%
of the drug users surveyed in each year. 1999 saw an
increase in occasional use compared to experimental
use, and a statistically non-significant increase in
the (very small) number of daily users. Heavy crack
users can smoke several grams, if available in the course
of a "binge".
Methodology
IDMU surveys
were all conducted via anonymous questionnaires distributed
at pop festivals, pro-legalisation rallies, via direct
mailings from "user-friendly" organisations,
and via snowballing. Each year was a fresh cross-sectional
sample, although a few individuals participated in two
or more surveys.
Virtually
all of the respondents in every year had used cannabis,
the requirement for acceptance was that all respondents
should have used an illegal drug at least once. In practice,
around 60% of each sample were daily cannabis users,
with virtually all having used cannabis in the past
month - the most extreme category used in the British
Household Survey to monitor trends in population prevalence,
and would be broadly representative of drug users within
that category. Overall population prevalence for each
use level may be estimated with reference to (a) the
proportions from the whole survey multiplied by the
number of "used in past month" cannabis users
in the British Crime Surveys, or (b) the relative proportions
of users at each level taken with the numbers reporting
"ever use" of particular drugs within the
BCS.
The nature
of the sampling techniques have resulted in under-representation
of problem drug users (heroin/crack) from inner cities,
who would not normally be expected to prioritize buying
tickets to commercial events ahead of buying drugs to
sustain their habits, or attend festivals or other events
where the availability of their drugs of choice would
be limited.
Although
"bliss" was devised as a fictitious street
name for a non-existent drug in 1994, a herbal high
of that name subsequently went on sale in the UK. From
1998 the bogus drug, used to detect unreliable entries,
was brought into line with the name ("Semeron")
used by the British Crime Survey.
Sample Sizes
Total sample
sizes were as follows:
1984 -
607, 1994 - 1333, 1997 - 1136, 1998 - 1153,
1999 - 2173
Total 6402
respondents
Matthew J
Atha BSc MSc LL.B
Co-Authorship
credits also due to Sean Blanchard & Simon Davis